CEOTR Projects / Co-op 实习项目
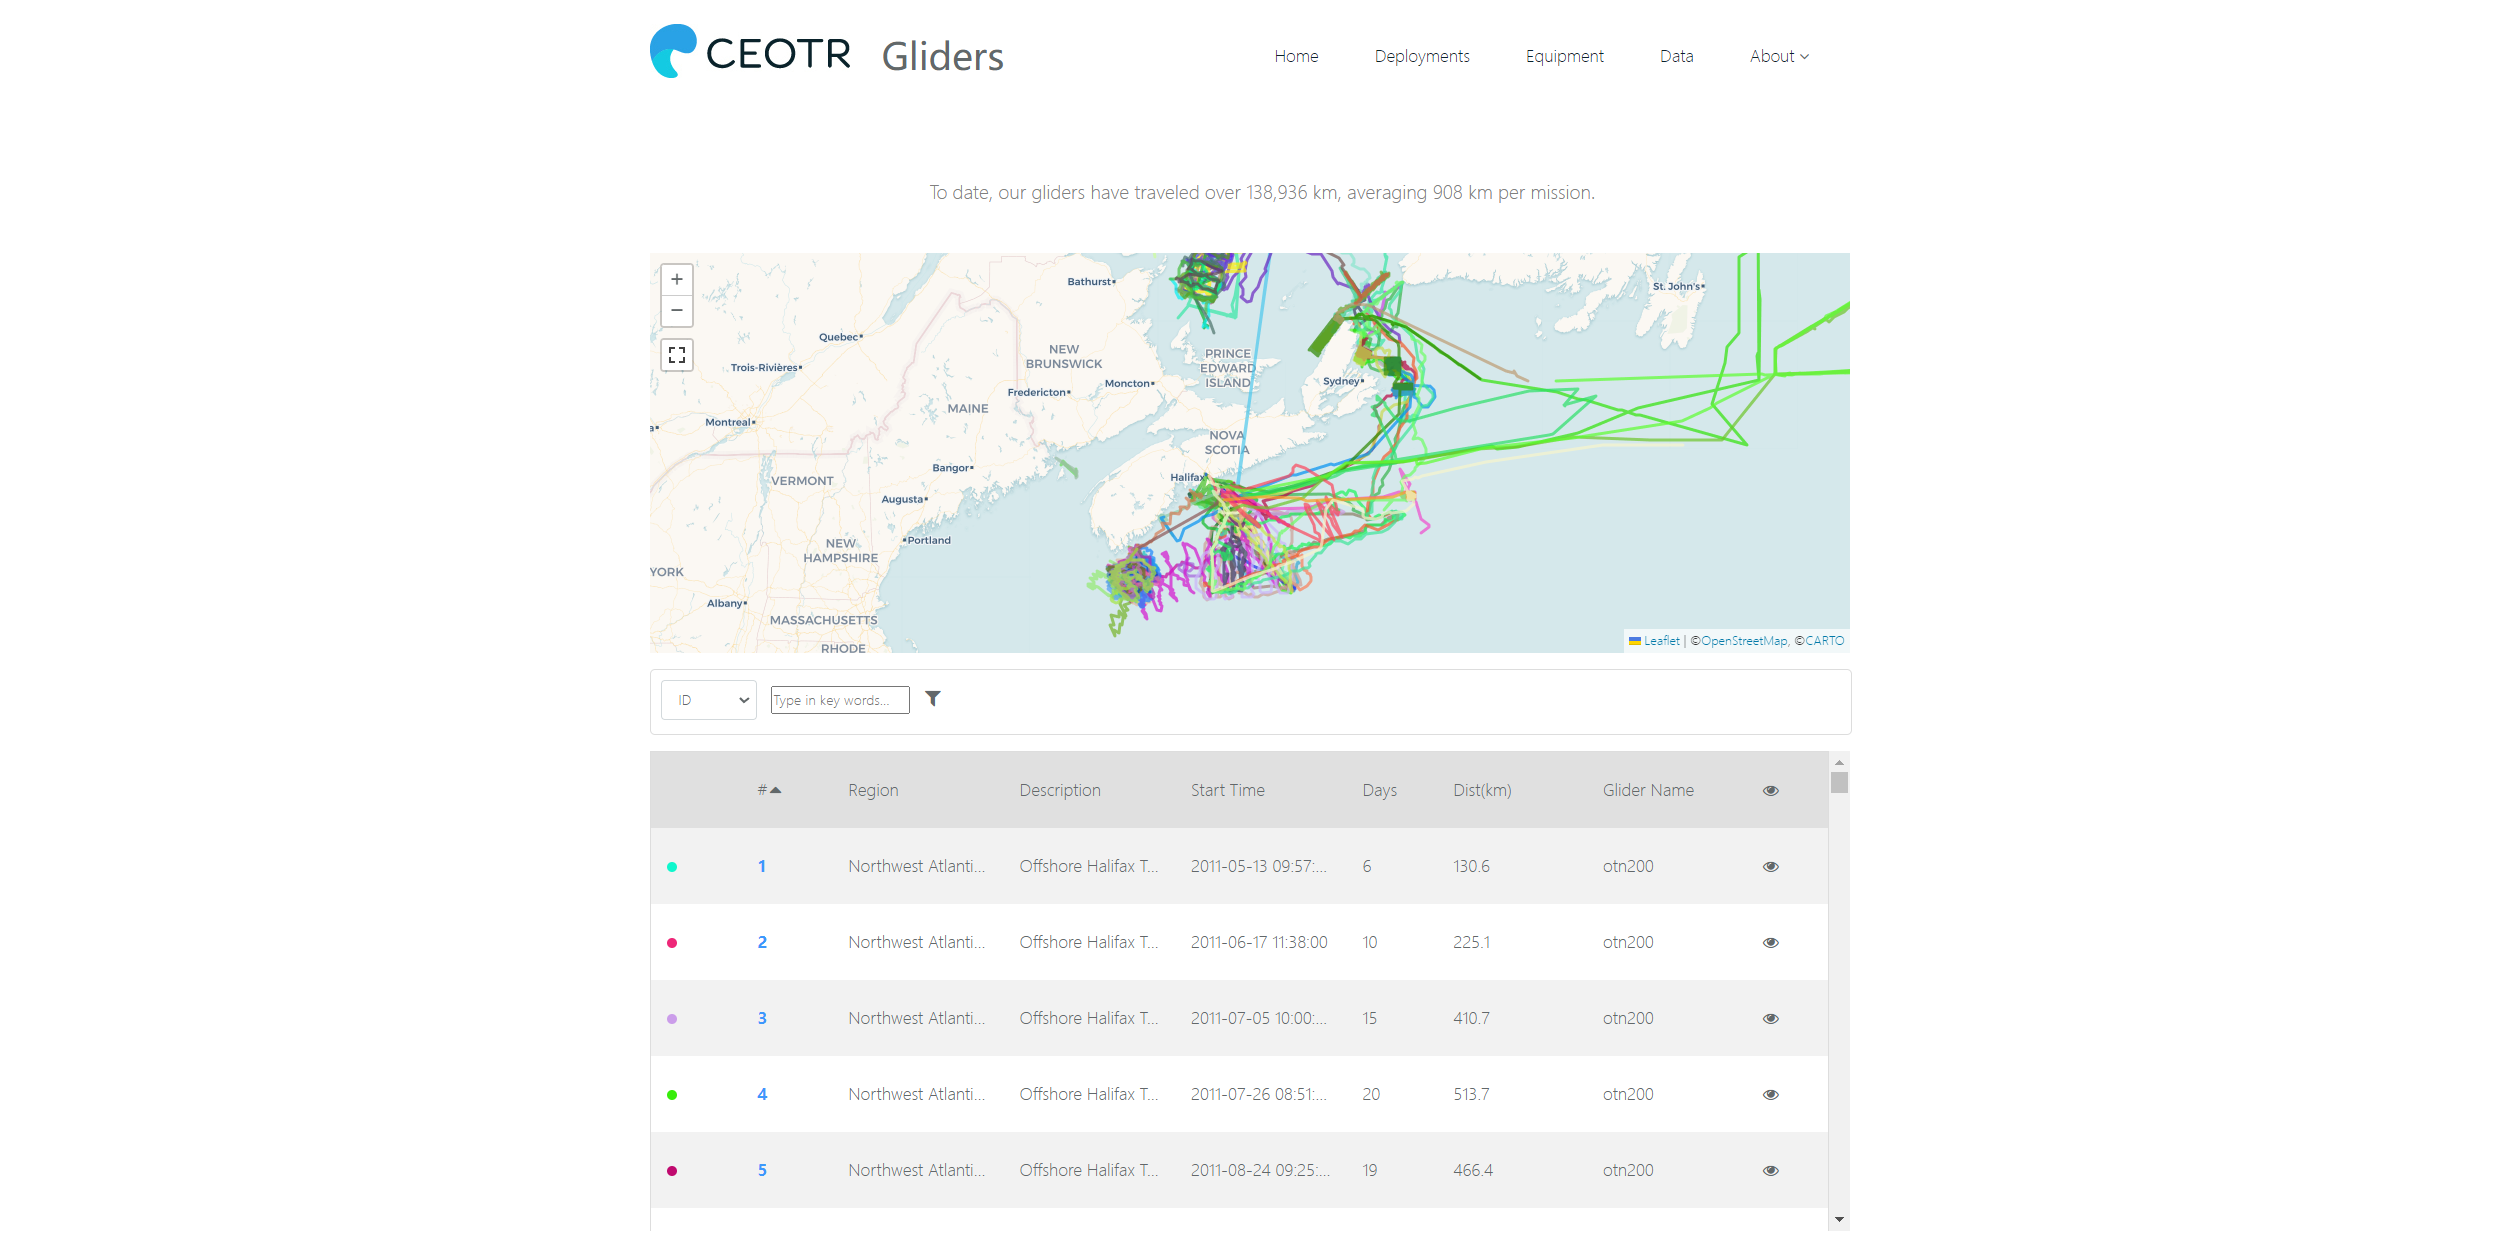
Glider Website (https://dev.ceotr.ca/gliders)

The Glider Website is built by Svelte-kit and focus on visualizing and summarizing the data collected from gliders and displaying them on the map and the table. The main page comprises three parts: map, filter, and table. The map is a Leaflet component. It can show each mission's track and be distinguished by different colors. When the user hovers over the track, the track will be highlighted and show summarized information. The table is sortable and shows detailed information. On the right side of the table, the eye button can control the show/hide for each track shown on the map, and the eye button on the table's header can simply show/hide all the tracks. The table is sorted by mission number by default, and the mission number is clickable. By clicking the mission number, the user will be directed to the individual mission page, which shows more detail. The filter bar can filter out the missions that the user wants. Select a tag (e.g. ID) and enter detail (e.g. ID that contains 44), and the filter option will display as a bubble. The map and table will reflect the changes by the filter's option.
C6 to CSV Converter (http://c6.ceotr.ca/)

The C6 to CSV converter website is built by Flask, and the function is implemented by Python. The website can convert the C6 file (a file type output by lab instrument) to a CSV file. Include the technic like auto zip/unzip, table reformation, batch download, data sorting, file upload, etc.
MAPEL Website (http://dev.mapel.ceotr.ca/)

The MAPEL website is built by WordPress. It is a blog website for the MAPEL group to post news and research articles and introduce their laboratory.